Debug Sidebar & Console
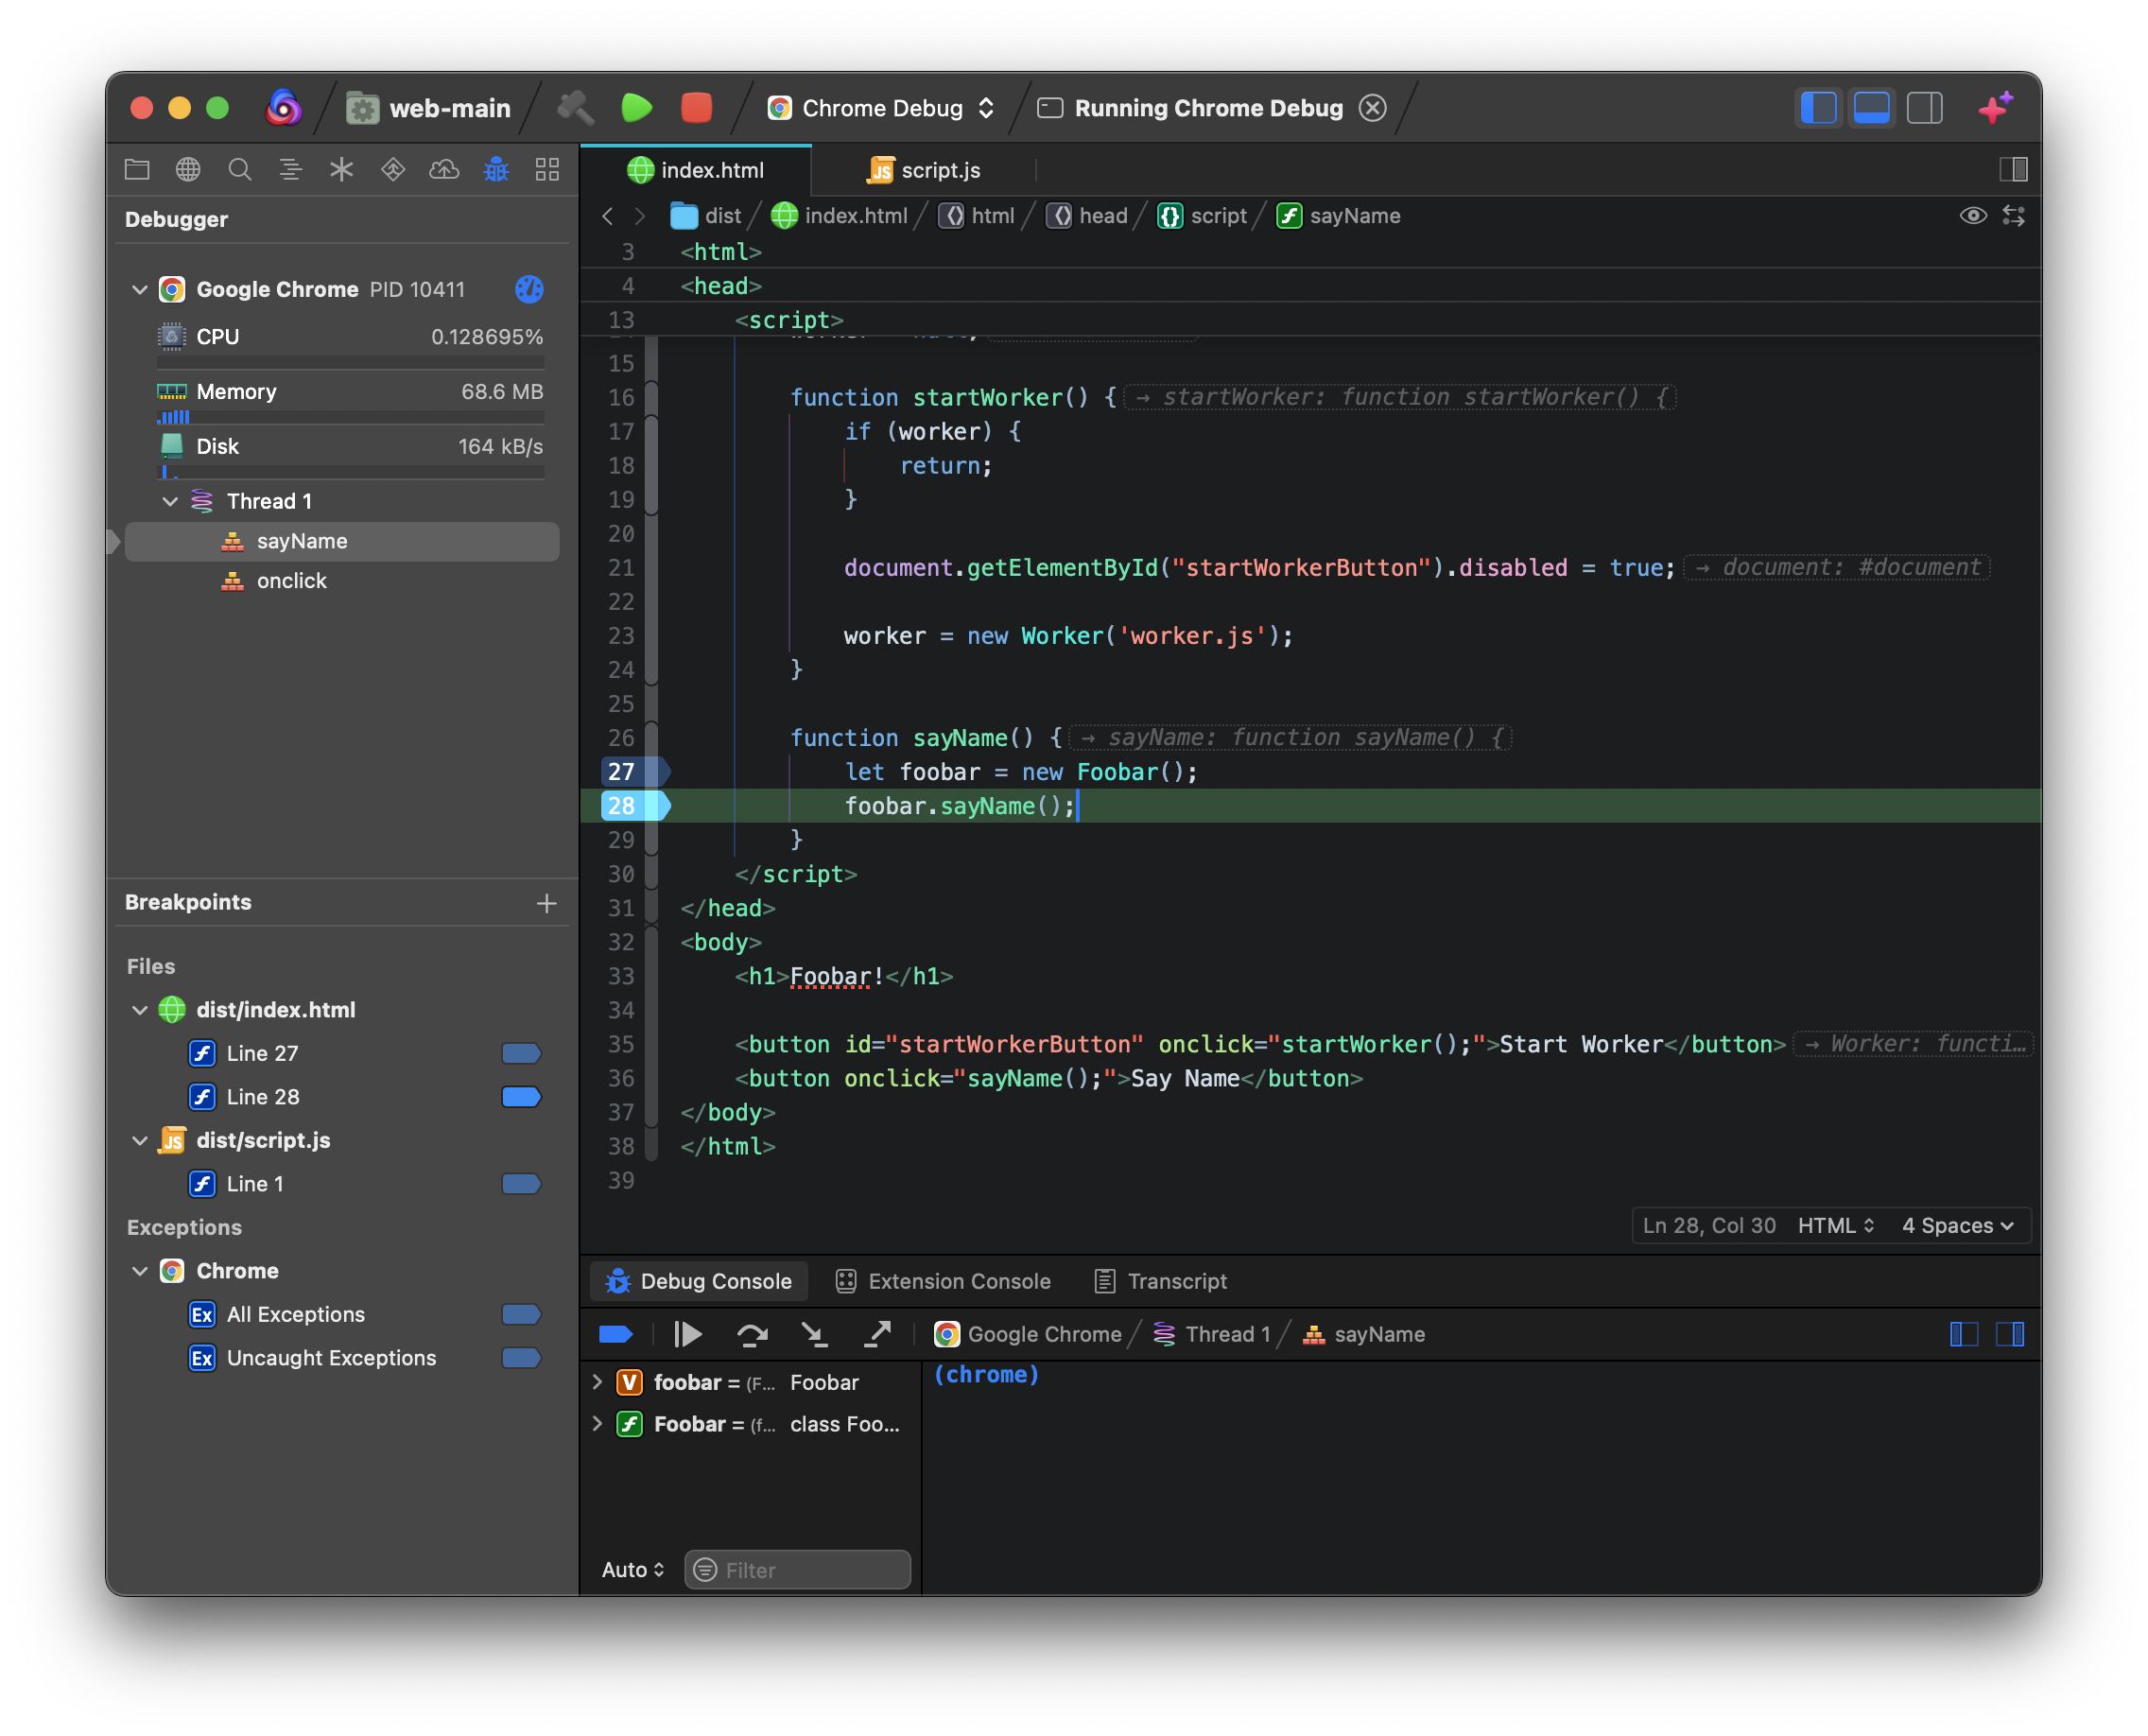
When running a Debug Task, your main interfaces for debugging your project in Nova are the Debug Sidebar and
Debug Console, which allow you to set and manage breakpoints in your code, and inspect variables and console output as your code is executed.
Debug Sidebar
|
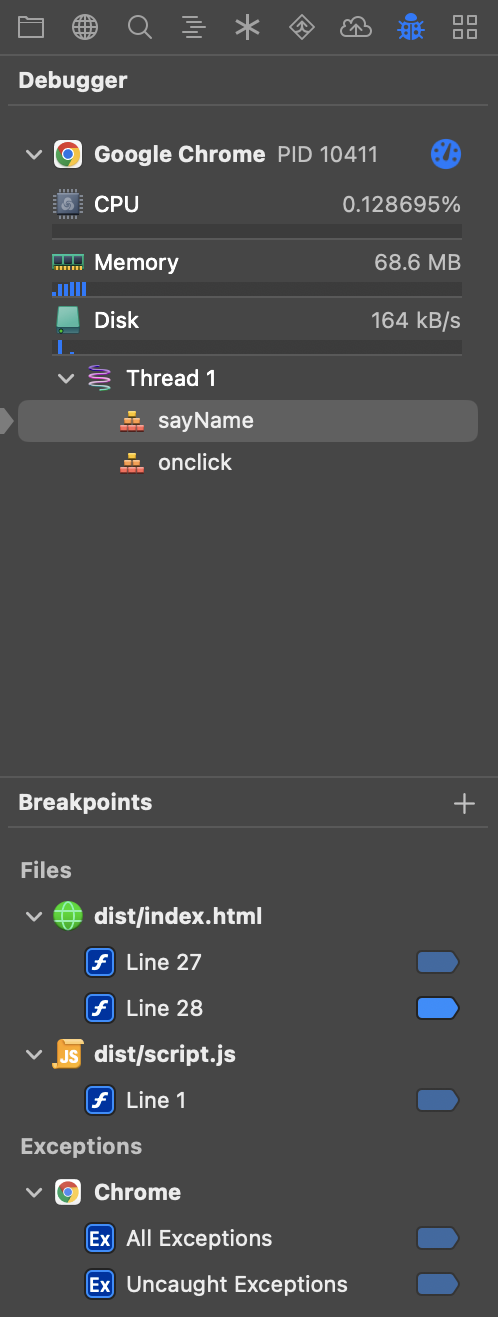
The While a Debug Task is running, it can also display performance information about your running site or application, such as CPU and memory usage, as well as functions or methods currently running on each thread. The Debug Sidebar is not visible in the Sidebar Dock by default, but can be accessed or docked manually from |
|
Setting Breakpoints
To set a breakpoint, simply click the line number of the desired line in the Gutter, or use Editor > Breakpoints > Add Breakpoint at Current Line (⌘Command+\). Once set, the breakpoint will be listed in the Debug Sidebar. Once added, click the ![]() icon to the right of a breakpoint to toggle it off or on. All breakpoints from across your project are listed here, allowing you to easily toggle them without having to open the associated file.
icon to the right of a breakpoint to toggle it off or on. All breakpoints from across your project are listed here, allowing you to easily toggle them without having to open the associated file.
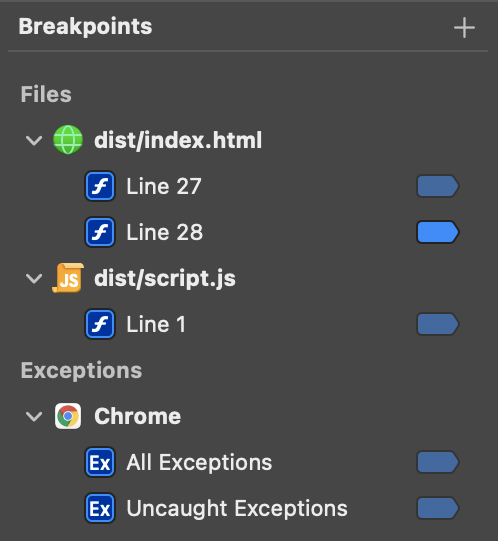
Some debuggers may also support exception breakpoints, which automatically trigger when an exception occurs while running your code. If available, these will be listed below your manually-set breakpoints, and can be toggled off and on as needed.
Editing Breakpoints
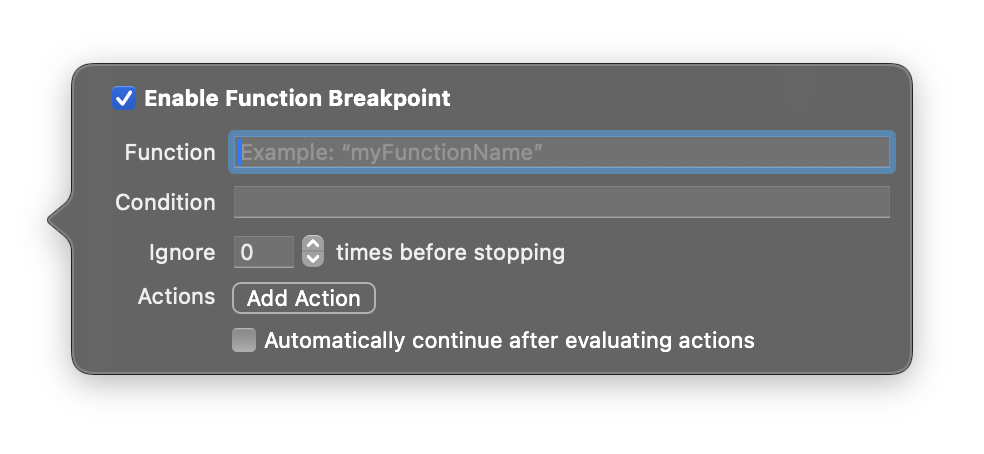
Double-click a breakpoint to edit it. This allows you to set some additional rules for when the breakpoint should be triggered, and what actions to take when the conditions are met.

- Condition
- Set a boolean condition that must be true for the breakpoint to be triggered. For instance, you can require a variable’s value to meet certain criteria, like
foo == trueorfooCount > 5. - Ignore X times before stopping
- Don’t trigger this breakpoint until it has been hit at least X number of times.
- Actions
- Upon hitting the breakpoint, you can have Nova automatically perform certain actions, including sending a debugger command, printing output to the console, or playing a sound. Multiple actions can be added (or removed) using the + and - buttons on the right.
- Automatically continue after evaluating actions
- When enabled, Nova will automatically continue execution of your code after performing any Actions set above.
Function Breakpoints
You can also manually create a function breakpoint by clicking the + icon at the top of the Breakpoints list in the Debug Sidebar. Function breakpoints are triggered whenever any function with the specified name is called. This can be useful for triggering breakpoints on all variations of a function (such as those with different arguments, or in different classes) without having to manually set breakpoints for each one.
Debug Console
The Debug Console allows you to interact live with your running Debug Task, including inspecting variables and sending debugger commands.

Execution Controls
While a Debug Task is running, you can control the execution of your code using the icons along the top of the Debug Console.
 Activate/Deactivate Breakpoints (⌘Command+Y)
- Toggle whether to automatically pause execution when an active breakpoint is hit.
/
Pause/Continue Execution (⌃Control+⌘Command+Y)
- Pause execution of your code, or if paused, continue executing as normal.
Step Over (F6)
- Continue execution, but pause on the next line.
Step Into (F7)
- If paused on a line that calls another function or method, continue executing but pause on the first line of the called function.
Step Out (F8)
- If paused in the middle of executing a function or method, continue executing but pause on the next line of code outside the scope of the current function.
With supported debug adapters, you can hold ⌃Control to step by instruction rather than stepping by line.
Inspecting Variables
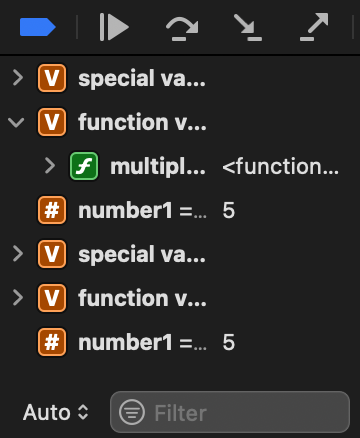
|
The left side of the Debug Console displays the symbol list, where you can inspect or introspect any allocated symbols and variables in your code. The value of variables will appear to the right of the variable’s name or identifier. Right-click a symbol to access additional options, such as editing the value of a variable, printing a description of the variable to the console, or copying the current value of the variable. You can also change the sort order of the symbol list from natural order to alphabetical, or from descending to ascending order. |
In Nova 13 and newer, you can also set watchpoints for a variable in supported debug adapters by selecting Watch from the variable’s context menu. These are breakpoints that automatically trigger when a variable’s value changes, and can be toggled in the breakpoints list like other breakpoints.
At the bottom of the symbol list are filtering options. You can choose to show all symbols, only local symbols, only global symbols, or have Nova automatically choose based on context. The Filter field allows you to list only symbols whose name or identifier contains a given value.
Console Output
On the right side of the Debug Console is the console itself. This console displays any console output from your running code. If supported, you can also evaluate expressions to manually execute functions, or print and change the values of variables. The exact syntax and supported expressions will vary depending on the language and debugger in use.
|
← Previous Debug Tasks |